Description
The ECAT 951/31R is a wholebody PET scanner. At the A&RMC, the PET scanner is
used largely in 2D mode for multi-bed wholebody acquisition, 2D mode for neurological
studies and 3D mode for neurological research studies.
The scanner system consists of a gantry with onboard analogue to digital processing,
a VME based acquisition control system, the ACS (Advanced Computational System)
and a Sun workstation used for the operator interface to control acquisition and
reconstruction of scans.
Scanner Specification - see
Facilities
Acquisition subsystem specification
The ACS is a VME based system operating VxWorks, a real-time data acquisition Operating
System. It consists of:
- Mizar 68020
- Motion Control System - controls patient bed, transmission rods, septa, gantry tilt
positions.
- Gantry communication - controls LLD, ULD settings.
- Ethernet interface
- VME BUS oriented acquisition System
- Real Time Sorter
- Sorts coincidence events (detector pair indices) and increments sinogram element
at determined plane, projection, view-angle
- 96 Mb memory supports up to 15 frames in memory
- SCSI
- 2 Gb + 675 Mb disk
- 8 mm tape (2.3 Gb)
- i860 array processor delivering 66 Mflop performance
- Filtered backprojection : reconstruction times 128x128 slice = 2.5 sec.
Operator console interface specification
The Sun/Sparc-V console
Scan Acquisition
Several scans are required in order to process an emission scan. These are divided
into calibration scans and study scans. The calibration scans are performed weekly
and consist of a normalisation and blank scan.
- Calibration scans
- Normalisation scan; this is acquired with two scans, the first with the rod-sources
extended and an empty FOV, so as to measure the cross-detector efficiencies. The
second scan is acquired with a uniform calibrated source placed in the FOV. The
nett result of these two measurements is the normalisation file which is used to
correct emission and transmission scans.
- Blank scan; this is acquired with the rod-sources extended and an empty FOV so as
to characterise the rod-source activity. The blank scan is then used to correct
the transmission scan so that an attenuation correction can be generated.
- In addition to the routine 2D calibration scans above, a 3D efficiency scan is also
acquired whereby the septa is retracted and a uniform source is placed in the FOV.
This scan is used as a normalisation for 3D acquired study scans.
- Study scans
- Transmission scan; Ideally, this is acquired prior to the patient being injected
with the PET tracer, however, in order to increase patient throughput it is more
frequently acquired after the emission scan has been completed when the infused
tracer activity is diminished. If acquired post-injection/emission acquisition,
then there will be emission contamination of the resultant transmission scan, this
is minimised to some extent due to rod-windowing whereby the encoded rod-position
is checked against the geometry of the determined Line Of Response to eliminate
non-transmission events. Typically, 10 minutes per bed position, though by applying
a segmented attenuation correction, a scan as short as 3 minutes is possible.
- Emission scan; this is acquired after infusion and uptake of the PET tracer. In
wholebody acquisition, there is a 3 plane (in 2D mode) overlap to account for the
decreased sensitivity of the end-planes. For 3d mode, the required overlap is 11
planes (referring to Exact/922 specification) mmmmmmmmore
- 2D vs 3D acquisition
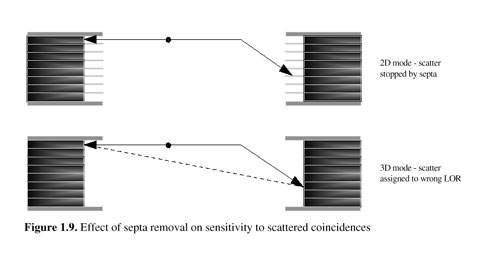
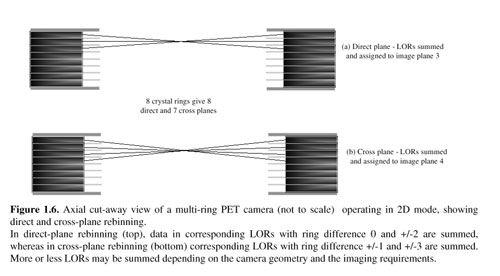
- Scans are acquired on the ECAT 951/31R in either '2D' or '3D' mode. The 2D acquisition
mode refers to the use of an extended septa which is used to limit to limit cross
ring-detector events. In 3D acquisitions, the septa are retracted allowing all-cross-ring
detector events to be recorded. This allows up to a 4-6 fold increase in sensitivity.
mmmmmmmore
- SETT
- SAC vs MAC vs CAC
CTI Hompage
Image Reconstruction
- FBP
- OSEM
- Other techniques
- Show tomography reconstruction demo from IDL
Image archiving
Local archiving to tape of all scans, normalisations, blanks, reconstructed images
Archiving of all reconstructed images to RAID system, imported into Online Nuclear
Medicine Image Database, archiving of RAID to 8-tape DDS-4 Autoloader.
Instrumentation & Q.C.
- Gas Delivery System
- Automated Blood Counter
- Block checks
- Gantry setup weekly
- 3d efficiencies
- Jayscyak phantom
- Line source phantom
- NEMA phantom
Introduction
The two features that distinguish PET from SPECT are; the increased count-rate efficiency
of due to electronic rather than physical collimation and the ability to simply
correct for attenuation effects of tissue.
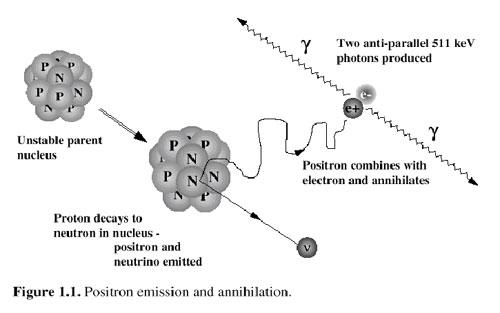
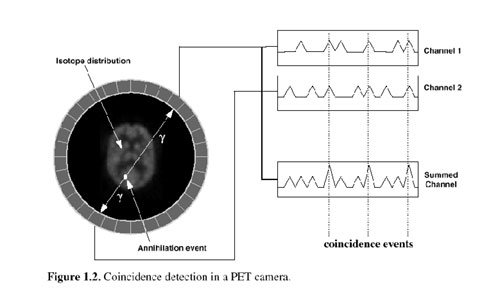
The ability to electronically collimate is due to the more sophisticated nature
of photon detection, by detecting the 0.511 MeV pair photons resulting from positron
annihilation.
Positron emitters
Four positron emitters are used routinely with the A&RMC PET facility. The table
below outlines the properties of interest.
|
Isotope
|
b+ energy (MeV)
|
b+ range (mm)
|
1/2-life
|
Applications
|
|
11C
|
0.96
|
1.1
|
20.3 min
|
receptor studies
|
|
15O
|
1.70
|
1.5
|
2.03 min
|
stroke/activation
|
|
18F
|
0.64
|
1.0
|
109.8 min
|
oncology/neurology
|
|
124I
|
2.1350/1.5323
|
1.7/1.4
|
4.5 days
|
oncology
|
Resolution effects
There are a number of factors determining the imaging resolution of the reconstructed
PET images. These can be categorised as follows:
- positron range
- annihilation non-collinearity
- detector size
The positron range contribution to the effective resolution is a result of the uncertainty
in the point of the positron emission. Positron paths follow a random path so that
the integrated positron range is much larger than the separation between the positron
annihilation and the positron emission point. For the isotopes of interest, the
FWHM range is 1.0 - 1.5 mm.
The non-collinearity term arises due to the probability of positrons annihilating
whilst in motion. The quoted angle between the two 0.511 MeV gammas is 180 +/- 0.25
degrees. With a ring diameter of ds, the resultant effect on resolution
is 0.0022ds. For the Siemens CTI/951R camera, ds = 1020 mm
=> 2.24 mm
The detector size response is given by a FWHM equal to half the detector element
width, for the 951R => 5.62/2 = 2.8 mm
Adding these terms in quadrature for 18F => Ö
(12 + 2.242 + 2.82) = 3.72 mm
Attenuation Correction
Photons emitted are absorbed as they pass through the body matter. To quantify this,
given I0 (cps) photons being emitted (where I0(x) =
r (x).DV), then the effect of travelling through
a medium is to reduce the number of counts detected, the source intensity is attenuated
and is described by; or casting this as a probability,
 . That is, the probability
that a photon emitted at point x=x' will be detected at x=0 is P(x). . That is, the probability
that a photon emitted at point x=x' will be detected at x=0 is P(x).
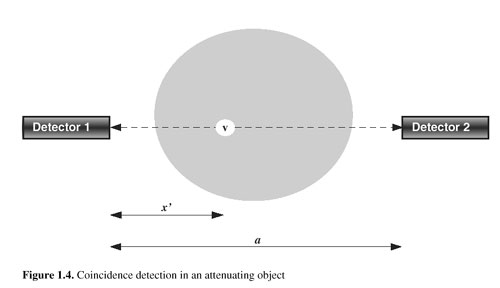
For PET, there are two photons as emitted as illustrated in the figure below (detector
1 at x=0, detector 2 at x=a, volume element v at x=x'). The probability of detection
by the 2nd detector is;

So the probability that both will be detected is; P = P1(x').P2(a-x')=

By taking the -ve of the natural log, we have:
 which when back-projected gives us a mu-map. The attenuation coefficient
m(x) is a function of the attenuating
medium's physical properties ( atomic number and density) and the energy of the
photon (m(x,E)=s(E).r(x)). For water and 0.511 MeV photons,
mwater(0.511MeV) =0.09695 cm-1,
which gives a half-depth, the depth at which 1/2 the initial photons have been absorbed,
of 7.15 cm.
So the Line Of Response (LOR) can be corrected for attenuation effects by measuring
the attenuation fraction anywhere along the LOR. The most convenient place to measure
the attenuation is then outside the imaging FOV. This is achieved with a rotating
68Ge rod source and is measured prior to or post emission, the measurement
is done with the septa extended (ie. 2D mode). It can also be measured simultaneously
but that's another topic of discussion.
From the above, you can see that in order to generate an attenuation correction,
we need a measure of I0, the transmission rod's activity. This is the
purpose of taking a blank scan and they acquired weekly as part of the scanner QA.
A blank scan involves acquiring a sinogram with no attenuating medium in the scanners
FOV. Also as part of the scanner QA, a normalisation scan is acquired which involves
placing a uniform source (~ 2-3 mCi of 68Ge in a 6 litre volume) in the
scanner FOV.
The resultant files that you will be familiar with are:
- p0xxxxtr1.scn transmission scan
- p0xxxxtr1l.scn log, blank corrected p0xxxxxtr1.scn
- p0xxxxtr1.atn normalised, smoothed p0xxxxtr1l.scn
- p0xxxxtr1.img back-projected p0xxxxtr1l.atn
The attenuation file, p0xxxxtr1.atn, is used for attenuation correcting the LOR's
of the emission scan. That is, the emission scan is corrected in sinogram coordinates.
(Chang correction applied in image coordinates).
Normalisation & 3d efficiency
Normalisation refers to the correction of a 2d sinogram for different cross-detector
efficiencies. This term is made up largely of intrinsic detector efficiencies *
geometric efficiencies. Normalisation is measured by acquiring a 90 minute with
the transmission rods extended.
The 3d efficiency scan is the equivalent of a normalisation scan, it is acquired
by placing a uniform source in the FOV and acquiring for 12 hrs
Uncorrected contributions
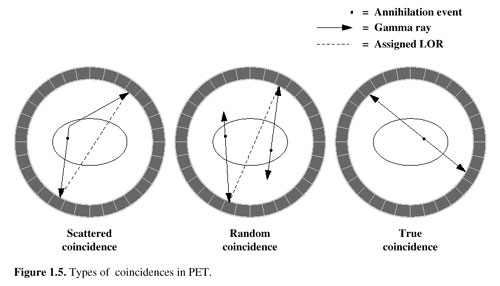
Scatter events result when one of the outgoing annihilation photons interacts (remember,
mwater(0.511MeV)
=0.09695 cm-1, => half absorbed within 7.15 cm) and scatters elastically
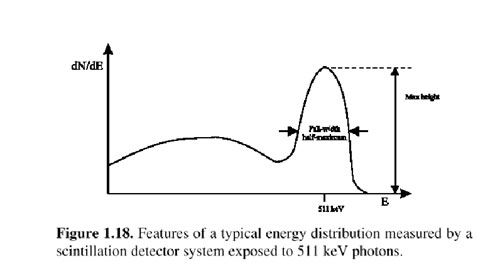
(no energy loss) or inelastically with small energy loss so that it still is recorded
in the LLD-ULD range (LLD=350 keV, ULD=850keV).
3D processing
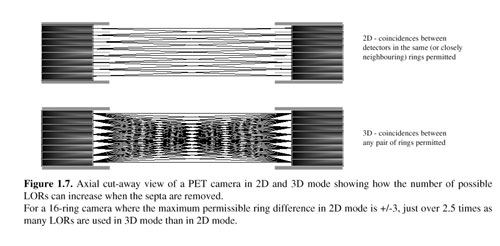
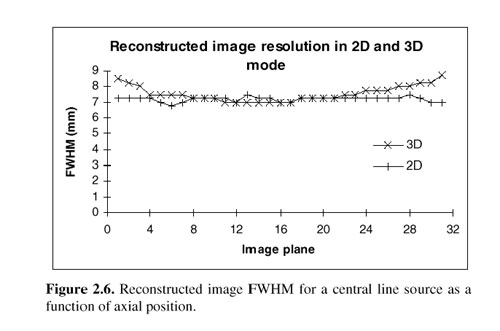
We use the 3D Reprojection/Filter-BackProjection (3D-RP) method of Kinahan &
Rogers. A maximum ring difference of +/-5 is used. This results in a drop off in
the effective 3d efficiency for the end planes, as then you only have say the +5
rings, see below. FORE (Fourier Rebinning), an approximate 3d -> 2d rebinning,
addresses this issue and allows the full ring (+/-16) difference to be used
|