Bio-inspired Image Processing.
3. Object Recognition in Natural Environments.
The recognition of objects in natural environments is a
very difficult task, mainly because of the wider variety of possible objects and
the impossibility to have control over external conditions. One example of such
kind of environments is the inner space of sewage pipes. In the FhG-IPK a system
for the automatic visual inspection of sewage pipes was developed [Ruiz-del-Solar
and Köppen, 1996]. Two important tasks to be performed in this system are the automatic
detection of pipeís sockets and the segmentation of internal wall images. In subsection
3.1 a neural architecture for the automatic socket detection in video images, the
SBCS-Architecture, is presented. The detection of edges is a fundamental part of
the process of image segmentation. A fuzzy based architecture, the FHAAR-Architecture,
was developed to perform this task in highly variant environments. In section 3.3
the FHAAR-Architecture and its application to the segmentation of internal wall
images of pipes scenes is described. Finally, the FUZZ-GIDO, an operator for the
detection of symmetrical objects, which is based in the same biological principles
of the FHAAR-Architecture is described in section 3.2. It should be stressed that
the main feature of these architectures and of the FUZZ-IDO is their robustness.
3.1. Pipeís Socket Detection using the SBCS-Architecture.
Sewage pipes have to be periodically inspected because
of economical, environmental and juridical reasons. The small diameter of pipes
does not allow direct human inspection of them. Visual inspection through the processing
of inner images is an established possibility to perform this task. The inspection
is performed through the processing of a video signal. This signal is taken by a
CCD-camera mounted on a remote controlled canal-robot, which moves through the inner
parts of the pipes (see figure 3.1). Automating the visual inspection process saves
human time and effort and can provide accurate, objective, and reproducible results.
Additionally, automation can eliminate human errors resulting from fatigue or lack
of concentration. A system for the automation of sewage pipe inspection was developed
(see description in [Ruiz-del-Solar and Köppen, 1996]).
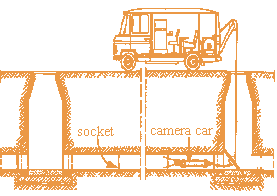
Fig. 3.1 Sewage pipesí inspection system.
The automated inspection system works as follows: the camera-car
moves through the pipes and looks for the location of the pipes' sockets, because
of most of the pipes's faults are placed in the socket's surrounding area. Each
time a socket is detected the camera-car films its surrounding area. Later this
information is off-line analyzed. From the above description it is clear that the
automatic socket detection must be performed in real time. The detection system
must be also very robust, because of the variable environmental conditions inside
the pipes (variable illumination, lack of equidistance between the sockets, presence
of physical obstacles such as solid substances and water, etc). To implement the
detection of sockets a very robust, neural-based architecture, the SBCS-Architecture,
was designed. The mechanisms used in the architecture are motivated and justified
by evidence from psychophysics and neurophysiology. They were adapted and simplified
taking into account the main system characteristics, which are real time processing,
variable environmental conditions inside the pipes, and some a priori knowledge
of the physical system properties (geometry of the pipes, CCD camera, and camera-car).
The block diagram of the SBCS-Architecture is shown in figure 3.2. This architecture
is composed of three subsystems: PSS (Preattentive Segmentation Subsystem), ORS
(Object Recognition Subsystem), and FS (Foveation Subsystem). The PSS segments the
input image, or more exactly, a reduced image obtained from the original one. It
has two inputs, the VIS (Video Input signal), and the PFS (Parameter Feedback Signal),
which is a signal coming from the ORS that allows adjustment of local parameters.
The ORS detects the pipes' sockets taking as input the output of the segmentation
process (SOS - Segmentation Output Signal). Finally, the FS keeps the camera focus
centered in relation to the main axis of the pipes. It receives an input signal
(SMS -Spatial Mapping Signal) from the PSS and sends the FFS (Foveation Feedback
Signal) to the camera-car.
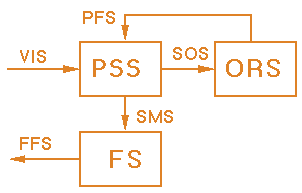
Fig. 3.2. Block diagram of the SBCS-Architecture.
3.1.1. Preattentive Segmentation Subsystem (PSS).
The Preattentive Segmentation Subsystem (PSS) is formed
by three modules (see the block diagram shown in figure 3.3), called: SCLM (Spatial
Complex Logarithmic Mapping), DOI (Discount of Illuminant), and SBCS (Simplified
Boundary Contour System).
3.1.2. SCLM (Spatial Complex Logarithmic Mapping).
The SCLM module performs a complex logarithmic mapping
of the input signal. This mapping is implemented using the Polar-Logarithmic Transformation
(explained in section 7.1). The SCLM module takes advantage of the circular system
symmetry by focalizing the analysis into circular image segments, which allows a
significant diminution of the data to be processed. This data diminution is produced
by the logarithmic sampling of the input signal in the radial direction and by the
constant sampling (the same number of points is taken) in each angular sector to
be transformed. Additionally, the complex logarithmic mapping provides an invariant
representation of the objects, because rotations and scalings on the input signal
are transformed into translations [Schwartz, 1980], which can be easily compensated.
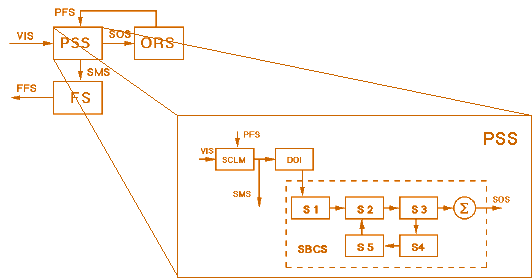
Fig. 3.3. Preattentive segmentation subsystem
(PSS).
3.1.3. DOI - Discount of Illuminant.
In this stage variable illumination conditions are discounted
by a shunting on-center off-surround network (defined in [Grossberg, 1983]), which
models the receptive fields response of the ganglions cells of the retina. Image
regions of high relative contrast are amplified and regions of low relative contrast
are attenuated as a consequence of the discounting process.
3.1.4. SBCS - Simplified Boundary Contour System.
The SBCS module corresponds to a simplified and modified
version of the Boundary Contour System (BCS) developed at the Boston University
[Grossberg and Mingolla, 1985]. The BCS model is based primarily on psychophysical
data related to perceptual illusions. Its processing stages are linked to stages
in the visual pathway: LGN Parvo->Interblob->Interstripe->V4 (see description
in [Nicholls et al., 1992]). The BCS model generates emergent boundary segmentations
that combine edge, texture, and shading information. The BCS operations occur automatically
and without learning or explicit knowledge of the environment. The system performs
orientational decomposition of the input data, followed by short-range competitive
and long-range cooperative interactions among neurons. The competitive interactions
combine information of different positions and different orientations, and the cooperative
interactions allow edge completion. The BCS has been shown to be robust and has
been successfully used in different real applications like processing of synthetic
aperture radar images [Cruthirds et al., 1992], segmentation of magnetic
resonance brain images [Lehar et al., 1990; and Worth, 1993], and segmentation
of images of pieces of meat in an industrial environment [Díaz Pernas, 1993].
In general the standard BCS algorithm requires a significant
amount of execution time that does not allow its utilization in our real time application.
For that reason the SBCS was developed. It uses monocular processing, only the "ON"
processing channel, a single spatial scale, and three orientations (a description
of these characteristics can be found in [Grossberg, 1994]). Each processing stage
of the SBCS model is explained in the following paragraphs.
Oriented Filtering Stage (S1).
Two-Dimensional Gabor Filters are used as oriented filters.
These filters model the receptive fields of simple and complex cells in the visual
cortex. Only odd-symmetric filters, which respond optimally to differences of average
contrast across its axis of symmetry, are used. By taking into account the image
circular symmetry and their posterior logarithmic mapping, only three oriented filters
are used (see figure 3.4).
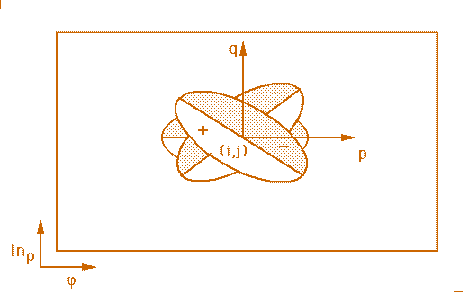
Fig. 3.4. Oriented filter masks.
First Competitive Stage (S2).
Cells in this stage compete across spatial position within
their own orientation plane. This is done in the form of a standard shunting equation
with two additional terms, a tonic input (T) and a feedback signal (V)
that comes from a later stage (Feedback Stage). Our modified dynamic shunting
equation is given by:
 (3.1) (3.1)
At equilibrium, this equation is determined by:
 (3.2) (3.2)
where W is the output of this stage; J is the output of the Oriented
Filtering Stage; G is a gaussian mask; k is the orientation
index; p,q,i,j are position indexes; and A, B, C are
constants.
Second Competitive Stage (S3).
At this stage competition takes place only across the orientation
dimension, i.e. cells compete with other cells that have the same position but different
orientation. As in [Lehar et al. 1990], the equilibrium condition for this
dynamic competition is simulated by finding the maximal response across the orientation
planes for each image position, and by multiplying all non-maximal values by a suppression
factor.
Oriented Cooperation Stage (S4).
The oriented cooperation is performed in each orientation
channel by bipole cells that act as long-range statistical AND-gates. Unlike the
standard BCS model we use bipole cells whose receptive fields have collinear and
non-collinear branches (see figure 3.5). These receptive fields have properties
consistent with the spatial relatability property (deduced from studies performed
by [Kellman and Shipley, 1991], which indicates that two boundaries can support
an interpolation between themselves when their extensions intersect in an obtuse
or right angle. The cooperation in the left-half receptive field (Lijk)
is performed among neighboring cells with the same orientation, and the cooperation
in the right-half receptive fields (Rijk) among neighboring cells
across all the orientations. At equilibrium, the output from this stage is defined
by:
 (3.3) (3.3)
with
 (3.4) (3.4)
and
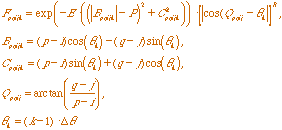 (3.5)
(3.5)
with Fpqijk the receptive field kernel; Bpqijk
and Cpqijk the rotated coordinates; Qpqij the
direction of position (p,q) with respect to the position (i,j);
Y the output of the Second Competitive Stage; r0 k and rmax k the ranges of relatable orientations;
D, E, P, and R constants; and Dq
the angle between orientations.
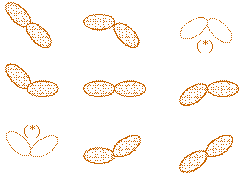
Fig. 3.5. Bipole cells with collinear
and non-collinear branches. The bipole cells (*) are nor used.
Feedback Stage (S5).
Before cooperative signals are sent to the first competitive
stage, a competition across the orientation dimension, and a competition across
spatial position take place in order to pool and sharpen the signals that are fed
back. Both competitions are implemented in one processing step.
3.1.5. Results.
As an example of the system processing capabilities, figure
3.6a shows a sewage pipe image. In this image one can see a socket (in white). Figure
3.6b shows the SCLM-Module output. It can be seen that the spatial mapping allows
a great data reduction (more than 10 times) that produces an equivalent reduction
in the processing time. Figure 3.6c shows the Segmentation Output Signal. It can
be seen that the input image (more exactly the transformed image) is segmented in
two areas: a white area, which corresponds to the socket area, and a black one,
which corresponds to the rest of the image. In the upper right quadrant one can
see noise that corresponds to some geometrical distortion produced by the mapping,
but does not disturb the sockets' detection. The segmented image is the input of
the ORS where the pipes' sockets are finally detected. That is performed by a SOM
(Self-Organizing Map) network.
Fig. 3.6. (a) Input Image (376x288 pixels);
(b) Spatial mapping signal (128x64 pixels);
(c) Segmentation output signal (128x64 pixels).
3.2. Fuzzy-based Detection of Symmetrical Object in real-word Scenes.
Since the development of pyramidal algorithms by Burt in
the early eighties [Burt, 1981] many researchers have been working on applying the
Multiresolution-Principle on the development of Image Processing Systems. As an
example, Daugman developed a system for iris identification that uses a circular
edge detector to locate the inner and outer boundaries of the iris [Daugman, 1993].
This detector is based on the use of integrodifferential operators to search under
different resolutions circular structures over the image domain. The circular detector
from Daugman was generalized by Ruiz-del-Solar to detect symmetrical real-world
objects such as pipes, valves and danger signals [Ruiz-del-Solar, Nowack and Nickolay,
1996; Ruiz-del-Solar, 1997]. An additional organizational principle present in the
visual system is the variable sensibility of the photoreceptors, which depends on
the luminance of the background, and allows the invariant perception of objects
under different lighting conditions [Spillman and Werner, 1990]. Pal and Mukhopadhyay
developed a fuzzy-based edge detector which makes uses of this organizational principle
[Pal and Mukhopadhyay, 1996]. This section describes the FUZZ-GIDO operator, an
operation for detection of symmetrical objects, which is based in the generalized
Daugmanís detector developed by Ruiz-del-Solar, and that uses the fuzzy-based concepts
introduced by Pal and Mukhopadhyay. The main characteristics of this new detector
are its robustness and its processing speed.
3.2.1 The FUZZ-GIDO Operator.
The circular edge detector proposed by Daugman is defined
by [Daugman, 1993]:
 (3.6) (3.6)
This integrodifferential operator is based on the application
of three operations: (a) a normalized contour integral along a circular arc over
the pixels of the input image I(x,y) with (x0,y0)
as center coordinates and r as radius, (b) a partial derivation of the contour
integral, with respect to the radius, and (c) a convolution (blurring) of the differentiation
result with a smoothing Gaussian of scale s ( ). All these operations are
discretely implemented. To speed up the calculations, the order of convolution and
differentiation are interchanged. ). All these operations are
discretely implemented. To speed up the calculations, the order of convolution and
differentiation are interchanged.
By considering not only circular contours in the calculation
of the line integral, the IDO can be generalized to detect symmetrical objects.
In this case the contour integral is calculated over a domain D, defined
by a function f() (analytical or a non-analytical) that specifies the form
of the symmetrical object to be detected (see figure 3.7).
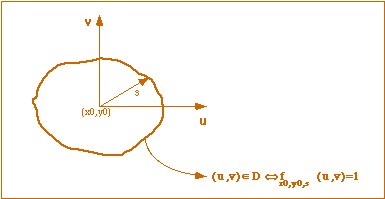
Fig. 3.7. Parameters of the GIDO
(after [Ruiz-del-Solar, 1997]).
This generalized IDO (GIDO) uses a scale
factor s (instead of the radius) and the center coordinates (x0,y0)
as parameters. It is (discretely) defined by [Ruiz-del-Solar, 1997]:
 (3.7) (3.7)
The GIDO was improved to allow the invariant perception
of objects under different lighting conditions. As it was mentioned, the perceived
contrast in an image depends on its local background intensity (luminance of the
background). For this reason a new fuzzy-based operator for symmetrical object detection
(FUZZ-GIDO) that takes into account the local background intensity, and is
based on the GIDO, was proposed in [Ruiz-del-Solar, 1998b].
A fuzzy reasoning system with the generalized edge detector
(GIDO) and the background intensity (B) as antecedent variables is
implemented. The consequent variable (output) of this system is the proposed FUZZ-GIDO.
The linguistic variables used are: PB (positive big), PS (positive
small), MED (medium) and ZE (zero). Triangular fuzzy sets are used
for all the variables. The IF-THEN rules employed are coded in Table 1.
|
GIDO
|
PB
|
PB
|
PB
|
PB
|
PS
|
PS
|
PS
|
PS
|
ZE
|
ZE
|
ZE
|
ZE
|
|
B
|
PB
|
PS
|
MED
|
ZE
|
ZE
|
PS
|
MED
|
PB
|
ZE
|
PS
|
MED
|
PB
|
|
FUZZ-GIDO
|
PS
|
PB
|
PS
|
PB
|
PB
|
PS
|
PS
|
ZE
|
ZE
|
ZE
|
ZE
|
ZE
|
Table 1. Codification of the 12 IF-THEN rules used (after [Pal and Mukhopadhyay,
1996]).
The background intensity (B) is calculated over the same domain D
used to calculate the GIDO (see figure 3.7), and given by:
 (3.8)
(3.8)
The defuzzification is performed by:
 (3.9)
(3.9)
where ci represents the center of mass of the normalized
triangular fuzzy sets of the FUZZ-GIDO linguistic variable, and
li corresponds to the firing strength of
each rule, calculated as the minimum between the membership functions of the GIDO
and the B linguistic variables.
3.2.2. The Multiresolution Algorithm for the FUZZ-GIDO.
The algorithm looks for the objects in the image by applying
the FUZZ-GIDO over all possible combinations of center coordinates and scale
factors. This search is performed under different resolutions by using the concept
of a virtual pixel (a group of real pixels). In each virtual pixel position the
FUZZ-GIDO is computed. All the operations involved in this computation are
performed over real pixels. The simultaneous use of virtual pixels (search) and
real pixels (calculations) makes possible to have a high processing speed without
a lost of precision. The algorithm iterates from coarse to fine resolutions by decreasing
the size of the virtual pixels. At each iteration step two Region of Interest
(ROI) are defined, one square for the center coordinates and one lineal for
the scale factor [Ruiz-del-Solar, Nowack and Nickolay, 1996]. Inside these ROIs
all possible combinations of center coordinates and scale factors are used to find
the maximum value of the FUZZ-GIDO. This maximum value is used to decide
the possible presence of an object in the ROI. After the maximum value of the FUZZ-GIDO
is found, the size of the virtual pixels is halved, and new ROIs are defined around
the virtual pixel position (in (x,y,s) space) of the maximum. The
algorithm stops when the virtual pixels have the same size as the real ones. Typical
values for the initial size of the virtual pixels are 4 or 8, that means that only
three or four iterations are necessaries to perform the search of an object. The
pseudocode of the algorithm is given by:
- Construction of the virtual pixels (size is application dependent). Typical values
are 4 or 8.
- Definition of the starting ROIs (size is application dependent), one square for
the center coordinates and one lineal for the scale factor.
- While (size of the virtual pixels 3 1) {
- Application of the FUZZ-GIDO in each virtual pixel position of the ROIs. The FUZZ-GIDO
is computed over real pixels.
- Calculation of the virtual pixel position (center coordinates and scale factor combination)
corresponding to the maximum value of the FUZZ-GIDO.
- Definition of new ROIs around the virtual pixel position of the maximum (extension
of the lineal ROI: 3 virtual pixels; extension of the square ROI: 3x3 virtual pixels).
- Reduction by a factor of 2 of the size of the virtual pixels.
}
3.2.3 Results.
Some examples of detection of real-world objects are presented. Figure 3.8a exemplifies
the detection of a pipe union in an internal image of a pipe. Figure 3.8b shows
the detection of the inner boundary of the iris. Figure 3.8c shows the detection
of circular structures in a valve image. Finally, figure 3.8d exemplifies the detection
of a real, danger signal. The presented objects are very difficult to detect, because
of the poor lighting conditions, as for example in figure 3.8a, and because of they
contain hidden areas (also see figure 3.8a), and distorted or not exact defined
edges, as in figures 3.8b and 3.8c. The extra complexity of the detection performed
in figure 3.8d, is given by the fact that the danger signal detected, doesnít match
exactly the searched one, which corresponds to a perfect rhombus.
Fig.3.8. (a) Internal image of a pipe. Detection of a pipe union;
(b) Eye image. Detection of the inner boundary of the iris;
(c) Valve image. Detection of the most brilliant circular structure;
(d) Detection of a real, danger signal.
3.3. FHAAR: An Architecture for the Automatic Edge Detection in real-world Scenes.
Taking the work developed in the previous section as a
starting point and using an edge detector, which follows Cannyís paradigm and is
derived from the use of Haar wavelets, a robust architecture for the automatic edge
detection in real-world scenes, was developed [Lohmann, Nowack, and Ruiz-del-Solar,
1999]. The motivation to develop this architecture was the necessity to have a robust
and fast edge detection module in the System for the Automatic Segmentation of real
Pipe Scenes described in section 3.1, and in a System for the Recognition of Number
Plates (also developed at the FhG-IPK Berlin).
3.3.1 The FHAAR - Architecture.
In this architecture the data and control flow are separated
(see the block diagram of ºure 3.9). The data flow contains four stages: Noise Filtering,
Averaging, Edge Detection and Fuzzy Processing. The control flow contains the Histogram
Processing and the Fuzzy Parameter Determination stages. The noise contained in
the input images is filtered in the Noise Filtering stage. Depending on Gaussian
or Impulsive noise is present in the images, a Gaussian-Filter or a Median-Filter
is applied. In the Averaging stage, the background information of the original image
is determined. A simple and hence fast averaging algorithm, which uses two 5-pixels-size
line-masks, one vertical and one horizontal, determines homogenous areas that are
larger than the relevant edge structure information. The relevant edge information
is calculated in the Edge Detection stage by using an edge detector that is based
on the use of the Haar-Wavelet. This edge detector is very robust against the variances
found in natural patterns, and is also implemented by using two 5-pixels-size line-masks.
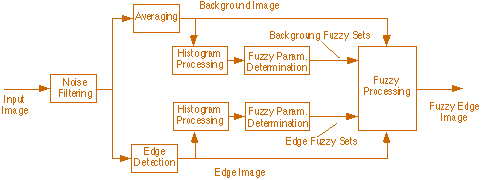
Fig. 3.9. Block diagram of the proposed
FHAAR-Architecture.
Based on the previously described data processing stages,
the Fuzzy Processing stage calculates the final fuzzy edge image by using an Edge
Image and a Background Image. This stage has as inputs data-dependent fuzzy sets,
whose membership functions are dynamically determined by using information obtained
from the cumulative histograms of the Edge and the Background Images. It must be
pointed out, that in the proposed architecture the fuzzy set parameters are automatically
determined and that the end-user must set only very few application-dependent parameters
(the size of some filter masks and some threshold values). These parameters depend
on the kind of images (i.e. on the application) being processed. More specifically,
on the kind of information contained in these images.
3.3.2 Edge Detection.
In general, Wavelets are mathematical functions that cut
up data into different frequency components, and then allow one to study each component
with a resolution matched to its scale. There is an important connection between
wavelets and edge detection, since wavelets are well adapted to react locally to
rapid changes in images. Moreover, the wavelet theory allows one to understand how
to combine multiscale edge information to characterize different types of edges.
Cannyí edge detector is one of the most often used detectors in vision algorithms.
Cannyís detection is equivalent to the detection of wavelet transform local maximum
[Mallat, 1996].
Canny provides valuable insights into the desired properties
of an edge detector [Canny, 1986]. The basic requirement is that an edge detector
should exhibit good performance under noisy conditions. The detector should fulfil
the following goals: Good Detection, Good Localization and Clear Response (see explanation
in [Canny, 1986]). The Canny model assumes an ideal step edge corrupted by Gaussian
noise. In practice this is not an exact model, but it represents an approximation
of the effects of sensor noise, sampling and quantization. Following Cannyís paradigm,
an image is first subject to low-pass smoothing and then a derivative operation
is applied (for edge detection by local maximum).
The proposed edge detector follows Cannyís paradigm, but
is implemented using a wavelet filter (after [Mallat, 1996], both approaches are
equivalent). The main reasons to choose a wavelet implementation are the fast processing
capabilities and the possibility to develop a multiscale version of our detector
in a near future. Due to its simplicity and fast implementation possibilities, the
Haar wavelet was chosen as our wavelet basis. The Haar wavelet is the simplest and
the oldest of all wavelets. It is a step function that is defined as [Strang and
Nguyen, 1996]:
 (3.10) (3.10)
By taking into account the equivalence between wavelets
and filter banks [Strang and Nguyen, 1996], a separable filter, which is based on
a redundant Haar decomposition, was derived. This decomposition performs a multiscale
smoothing of the local image information, and then a derivative operation. The proposed
filter, called Haar-Filter (HFilter), has a vertical and a horizontal five-pixel
component defined by the mask [1, 2, 0 ,-2 ,-1]. The modulus of both perpendicular
components is used to calculate the local maximum of the transform, or equivalent,
to find the edgesí location (see [Mallat, 1996]). Some optimizations (approximations!)
were performed to speed up the filter computation. First, a new five-pixel mask,
given by [1, 1, 0 ,-1 ,-1], was defined. The edge detection capability of this second
mask is almost the same as the first one, but its processing is much faster. Secondly,
to find the edgesí location, the operation of calculating the modulus of both perpendicular
components was replaced by the more simple one of calculating the maximum between
the absolute values of each perpendicular component.
3.3.3 Fuzzy Processing.
The described HFilter can be improved to allow invariant
edge detection under different lighting conditions. As it was pointed out, the perceived
contrast in an image depends on its local background intensity (luminance of the
background). The fuzzy-based edge detector here described, the so called Fuzzy-Haar-Filter
(FHFilter), is inspired by the work of Pal and Mukhopadhyay (see section 3.2), but
uses our HFilter as the basic edge detector and makes some other modifications to
the original architecture. A fuzzy reasoning system with the Haar Edges (HEdges)
and the background intensity (B) as antecedent variables is implemented. The consequent
variable (output) of this system is called Fuzzy-Haar Edges (FHEdges). The linguistic
variables used are ([Pal and Mukhopadhyay, 1996]): PB (positive big), PS (positive
small), MED (medium) and ZE (zero). Triangular membership functions are used for
all the variables. The IF-THEN rules employed are the same presented in table 3.1.
The defuzzification is performed by:
 (3.11) (3.11)
where ci represents the center of mass of the normalized triangular
membership functions of the FHEdges linguistic variable, and
li corresponds to the firing strength of each rule, calculated
as the minimum between the membership functions of the HEdges and the B linguistic
variables. To speed up the computations, all fuzzy sets were implemented by using
look-up tables. These look-up tables are initialized at the beginning of the fuzzy
processing.
3.3.4 Histogram processing and dynamic determination of fuzzy sets parameters.
The proposed fuzzy reasoning system has data-dependent
fuzzy sets, whose membership functions are dynamically determined by using information
obtained from the cumulative histograms of the Edge and Background Images. By means
of this automatic parameter adjustment our architecture works without parameters
adjustment for each kind of application and only some few parameters (the size of
some filter masks and some threshold values) must be adjusted between different
kinds of applications. In the Histogram Processing stage, the cumulative histograms
of the background and edge image are determined. By using these histograms and some
application-dependent threshold values (percents of the cumulative histograms) the
locations of the membership functions of the background and edge fuzzy sets are
automatically determined in the Fuzzy Parameter Determination stage. In figure 3.10,
the process of determination of the background fuzzy sets is exemplified. In the
case of non-existing high peak histogram values (only a peak histogram near the
gray level zero), a minimal fuzzy set is initialized. As it can be seen in figure
3.9, the process of determination of the edge fuzzy sets and the background fuzzy
sets is performed separately. The membership functions of the consequent variable
(FHEdges) are the same as the ones of the HEdges variable.

Fig. 3.10. Automatic determination of
background fuzzy sets using the cumulative histogram. A background image (behind),
its normal histogram (top-left), its cumulative histogram and the resulting fuzzy
sets (bottom-right) are shown. X, Y and Z correspond to application-dependent threshold
values.
3.3.5 Comparison with other edge detection algorithms.
Applications operating on images of real-world scenes,
especially outdoor scenes, have high demands on the reliability of the edge detection
process. These demands are various, sometimes not unequivocal, not well-defined
or even contradictory. Hence, sometimes it is not possible to associate these different
conditions with a formalism. Accordingly, the estimation of the suitability of an
edge detector is given by the result achieved in a real-world application. The operator
has to prove its ability for the processing of images with various kinds of data.
It must be also application independent. Finally, it has to be robust. In this section
the application of our architecture to the detection of edges in two real-world
images is exemplified (figures 3.11 and 3.12). Difficulties are as follows: Inhomogeneous
lighting conditions especially affect the task of edge detection. For instance,
edges starting in a bright area of the image and ending in a dark one will be more
difficult to detect, because edges are perceived stronger in bright areas. But the
structures in every part of the image have the same importance and have to be detected.
Two images are processed by using three different edge
detectors. The first image corresponds to an airplane image (see figure 3.11) and
the second one to a cast image (see figure 3.12). The used edge-detectors are the
Sobel-Operator, the HFilter and the here described fuzzy edge detector. Concerning
the first two operators we can say that the Sobel-Operator is prone to noise and
that the HFilter is insensitive to noise, but it does not adapt to the different
local intensities. The examples illustrate the suitability of the proposed fuzzy
edge detector for applications, that needs similar results in imageís areas with
various lighting conditions.
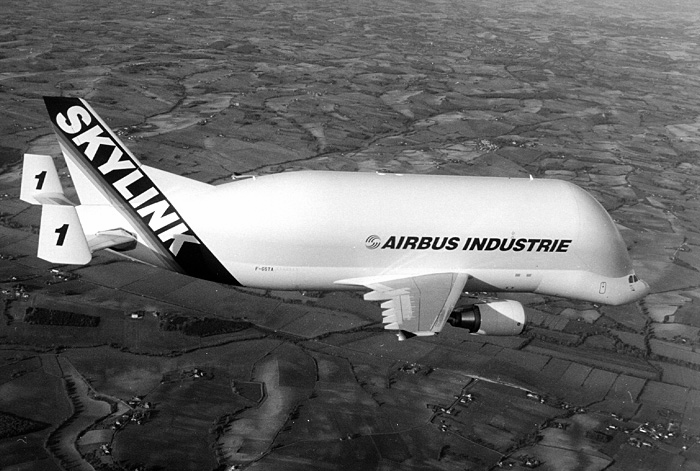 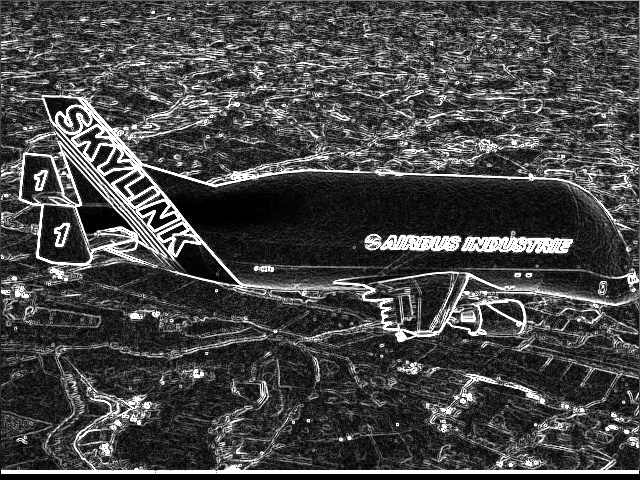  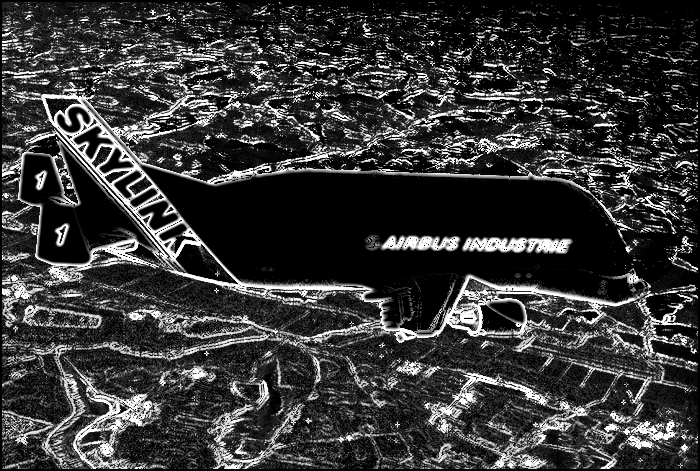
Fig. 3.11. Original airplane image and
its edge images: Sobel Edge Image, Haar Edge Image, Fuzzy Edge Image
(from left to right).
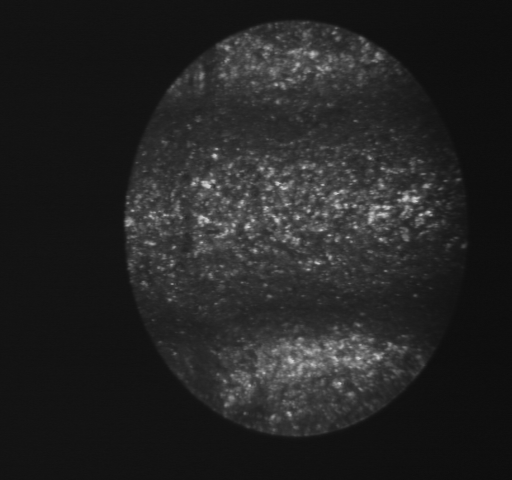 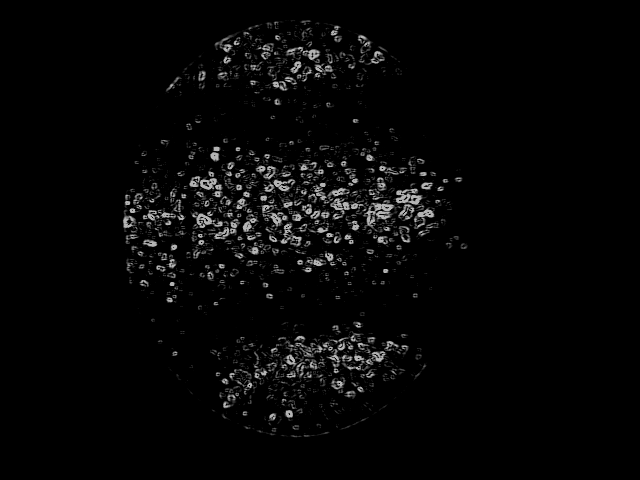 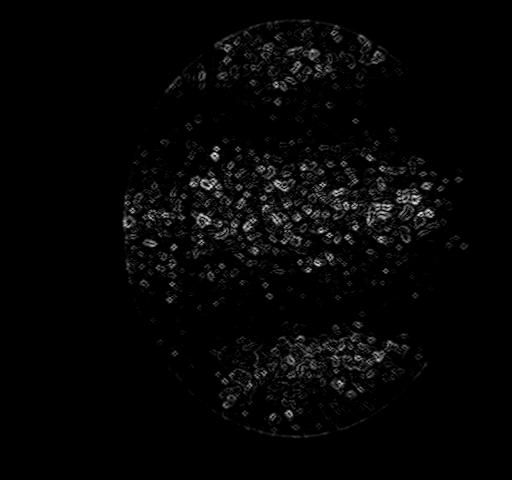 
Fig. 3.12. Original casting image with
an ore-defect (acquired by an endoscope camera) and its edge images: Sobel Edge
Image, Haar Edge Image, Fuzzy Edge Image (from left to right).
3.3.6 Integration of the proposed architecture in Vision Systems.
Automatic Segmentation of internal Wall Images in real Pipe Scenes.
The first step to evaluate the pipesí internal surface
is the segmentation of wall images. This segmentation is difficult, because the
pipes are subject of natural influences. Particularly, sedimentation, encrustation,
horizontal or vertical offset of two pipes, shards, roots and remaining water lead
to very different appearances. Furthermore, the lighting is irregular, that means
that for example gaps and sockets are more prominent in bright than in dark areas
of the image. For the subsequent steps of the pipes' processing an invariant segmentation
result is highly necessary, independent of these given lighting conditions. The
FHAAR-Architecture is used to detect the edges with a high reliability. Examples
of edge detection by our architecture are shown in figure 3.13. The final segmentation
of the images is performed using the Watershed Transformation [Beucher, 1982], which
need an edge and a label image. The edge image is obtained using the described architecture.
An example of the complete segmentation process of a real socket scene is shown
in figure 3.14.
 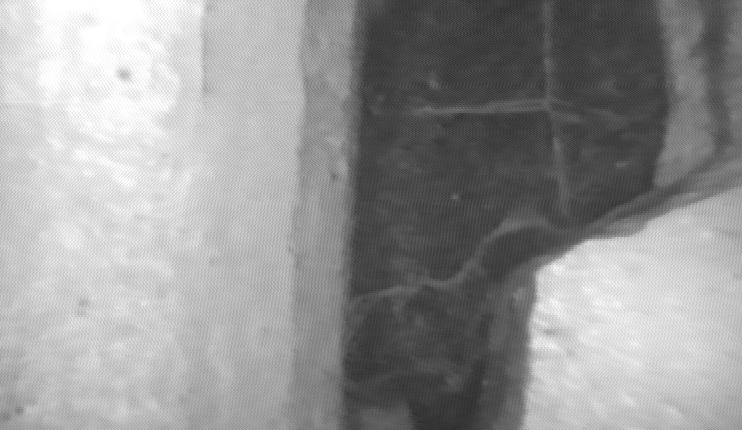 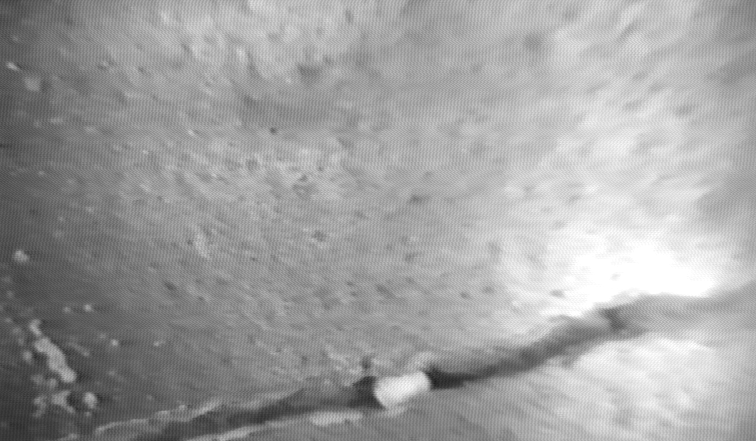
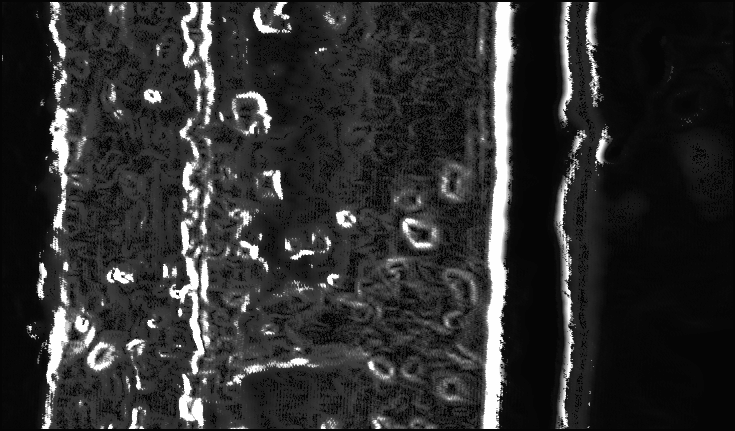 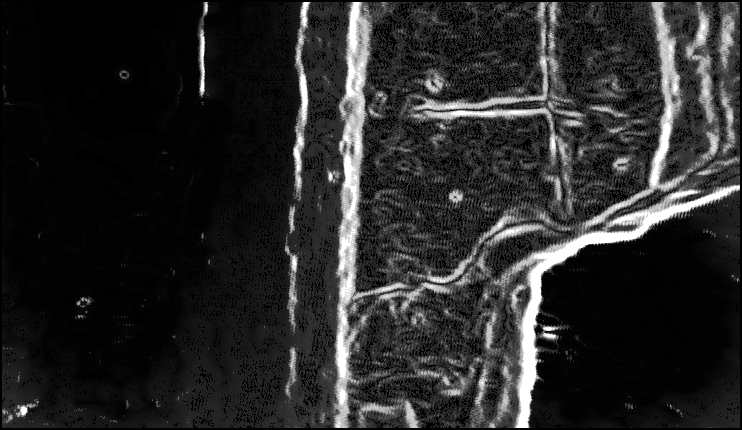 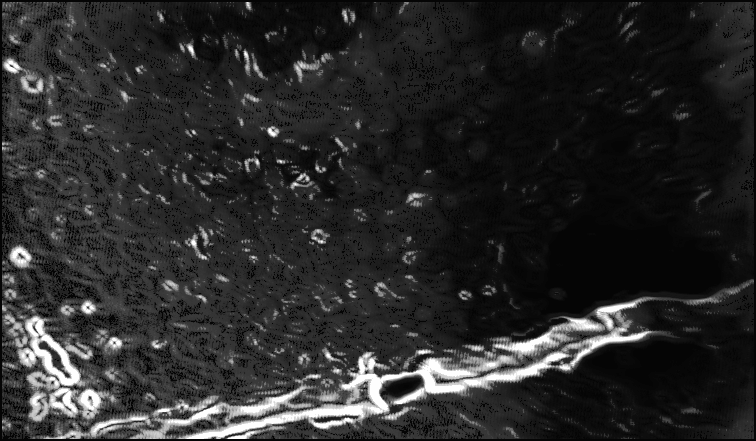
Fig. 3.13. Original (upper row) and edge
(lower row) images of sewage pipe scenes: Socket Image,
Shard Image and Fissure Image (from left to right).
Fig. 3.14. Segmentation of a socket scene.
Original socket scene with (from left to right)
the wall area, the so-called blending area, the socket area, the blending
area and the wall area (a);
Edge Image (obtained with the proposed architecture) (b); Label Image
(c); and Segmentation Image (d).
Recognition of Number Plates.
An interesting application field for the proposed edge
detection architecture is the vehicle identification. In the FhG-IPK (Berlin) was
developed a system consisting in two modules [Lohmann et al., 1997]: Recognition
of Number Plates and Identification of Shape Typical Vehicle Features.
The first module performs the following tasks: (1) Location of the number plates
structures and the charactersí area; (2) Charactersí Cleaning; (3) Charactersí Separation;
and (4) Charactersí Recognition.
One fundamental step of the recognition procedure is the
determination of the charactersí area (task 1), especially in images of real-world
scenes, which are influenced by different environment conditions. Charactersí areas
are detected from their structural properties (nearly parallel borders in a connected
image region). Filtering (low-pass and high-pass) and morphological operations are
used to find the sequence of characters. The verification of the extracted regions
is performed by evaluating regional features, e.g. features describing the holes
inside the connected components. For these reasons it is clear that a robust edge
detector is fundamental in the car platesí location process. The FHAAR-Architecture
was used to perform this task. Some results of its application are shown in figure
3.15. This figure show the real gray-value images and the results of the application
of the edge detection architecture, as an example for the search of number plate
structures and form-typical contour features from a car (figure 3.15a) and a lorry
(figure 3.15b). As it can be seen from these two examples, the proposed architecture
detects all relevant structure information, especially the number plate's information,
although the original images are very inhomogeneously illuminated. It can be concluded
that the proposed architecture is able to be used in the number plate location stage
of the described number plates recognition system. In figure 3.16, the successful
number plate recognition of the car shown in figure 3.15a is exemplified.
Fig. 3.15. Original car image and its
fuzzy edge image (a); and original lorry image and its fuzzy edge image (b).
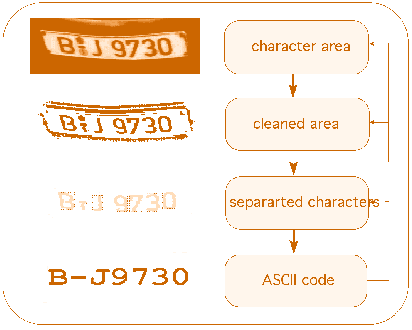
Fig. 3.16. Number plate recognition procedure.
3.3.7 Future Work.
The FHAAR-Architecture was modified to process vertical
and horizontal edges separately (see figure 3.17). A vertical and a horizontal edge
image are used. These images are obtained by using a V-Edge Operator and a H-Edge
Operator defined by the masks [1, 1, 0 ,-1 ,-1]T and [1, 1, 0 ,-1 ,-1],
respectively. After the convolution with this mask, the absolute value operator
is applied. Two fuzzy controllers, working in parallel, are used to process each
directional edge image. The final edges are found by taking the maximum response
of the fuzzy controllers, in each image position. The detection capabilities of
this second architecture are being investigated. A comparison with the FHAAR-Architecture
is also going to be performed.
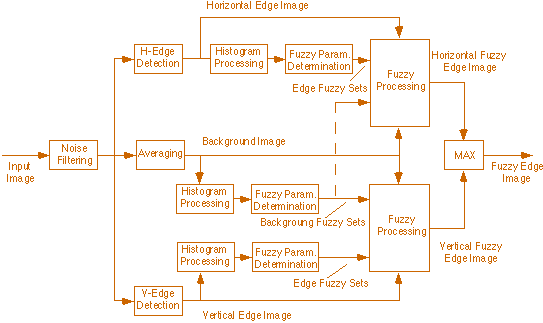
Fig. 3.17. Block diagram of the modified
FHAAR-Architecture.
|